Welcome to EasyRSEI, where you can access results and data from EPA's Risk-Screening Environmental Indicators (RSEI) model, Version 2.3.12.
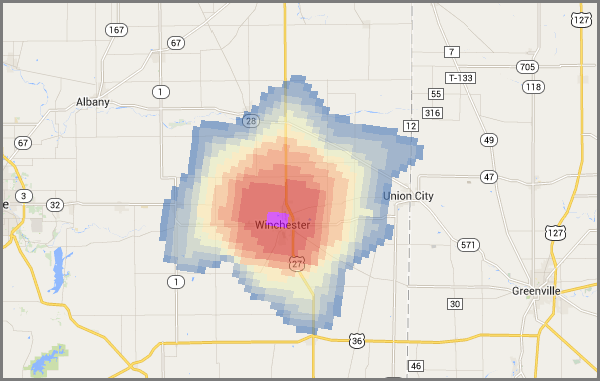
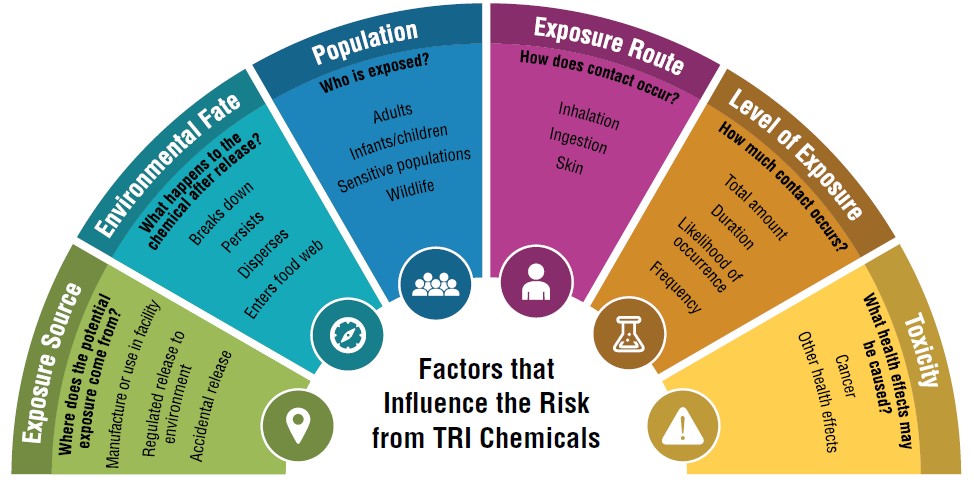
RSEI Scores add context to chemical data reported by facilities to the Toxics Release Inventory (TRI) from a relative risk-based perspective. RSEI Scores are calculated as unitless values that account for the magnitude of chemical releases, the fate and transport of the chemicals within the environment, the size and locations of potentially exposed populations, and the chemicals’ relative toxicities. Chemical releases to air or water are modeled and are combined with exposure assumptions and estimates, toxicity information, and population estimates to calculate these risk-related scores. RSEI Scores are available for modeled releases and transfers (air releases, water releases, and transfers off site to publicly owned treatment works (POTW) and to off-site incineration facilities). RSEI Score results incorporate toxicity information for both cancer and noncancer human health effects. RSEI Score-Cancer and RSEI Score-Noncancer results are also provided so users can examine those health effects separately.
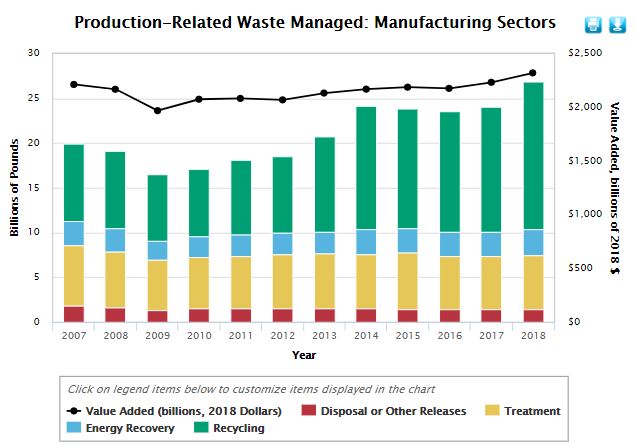
RSEI Hazard results add context to chemical data reported by facilities to the TRI from a relative hazard-based perspective. For these hazard-based results, no exposure modeling or population estimates are involved. Hazard-based values are calculated by multiplying reported chemical quantities (such as pounds released into the air) by a quantitative value (weight) that expresses the toxic potential (hazard) of the chemical(s) involved. These toxicity-weighted quantities account for their magnitude (e.g., how much is released to the environment) and also their relative toxicities (e.g., how potent are the chemical(s) in causing harmful health effects). RSEI Modeled Hazard results are calculated only for the modeled releases and transfers pertaining to RSEI Score as mentioned above, and RSEI Hazard results are calculated for all chemical waste management activity quantities reported to TRI.
RSEI Modeled Pounds are the chemical release and transfer quantities that are used for RSEI modeling as mentioned above. TRI Pounds are the quantities for all waste management activities as reported to the TRI. Both of these pounds-based results do not consider any adjustments for toxicity or for exposure potential and population size.
RSEI Website
Learn more about the RSEI model, how to use RSEI results, and how to access additional RSEI data products.
TRI Website
Learn more about the TRI program, how EPA collects TRI data, and how to access additional TRI data and tools.
TRI National Analysis
View an annual summary of TRI and RSEI data with sections on pollution prevention, releases, and waste management.
RSEI Microdata Dashboard
View an interactive dashboard of RSEI Geographic Microdata for air releases from the latest RSEI model year.
Use the links on the left to navigate through the other pages of the application. If you would like to filter your results, use the icon at the top right or the Filters and Options button to filter your selection by EPA Region, State, Year, Industry, or Chemical, or to change the display value from RSEI Score to RSEI Cancer Score, RSEI Noncancer Score, or RSEI Modeled Hazard.
You can start filtering using the options below and see the results on the RSEI Score national trend, as shown in the bar chart. Any filters you apply will be shown at the top of the screen and will apply to all charts and tables throughout the application.
Filter RSEI results by:
How to Use RSEI Results
RSEI does not provide a risk assessment, so it is inappropriate to use it to:
- Conclude that a particular chemical release is causing harm to a specific population or location,
- Draw conclusions or make decisions about the risk posed by any particular facility, or
- Draw conclusions about individual risk or generate quantitative risk estimates.
High RSEI Scores (relative to other RSEI Scores) can be used to identify areas that may warrant further investigation. High RSEI Scores do not conclusively demonstrate sources of risk. If a facility receives a high RSEI Score, it does not necessarily mean that the facility is harming people around it, or that the facility is not following applicable laws and regulations. If your community, or a facility in your community, has high RSEI Scores, you could use that information to help you decide if and what kind of further investigation is warranted.